
01 / GEOSPATIAL MACHINE LEARNING
Street-level flood mapping.
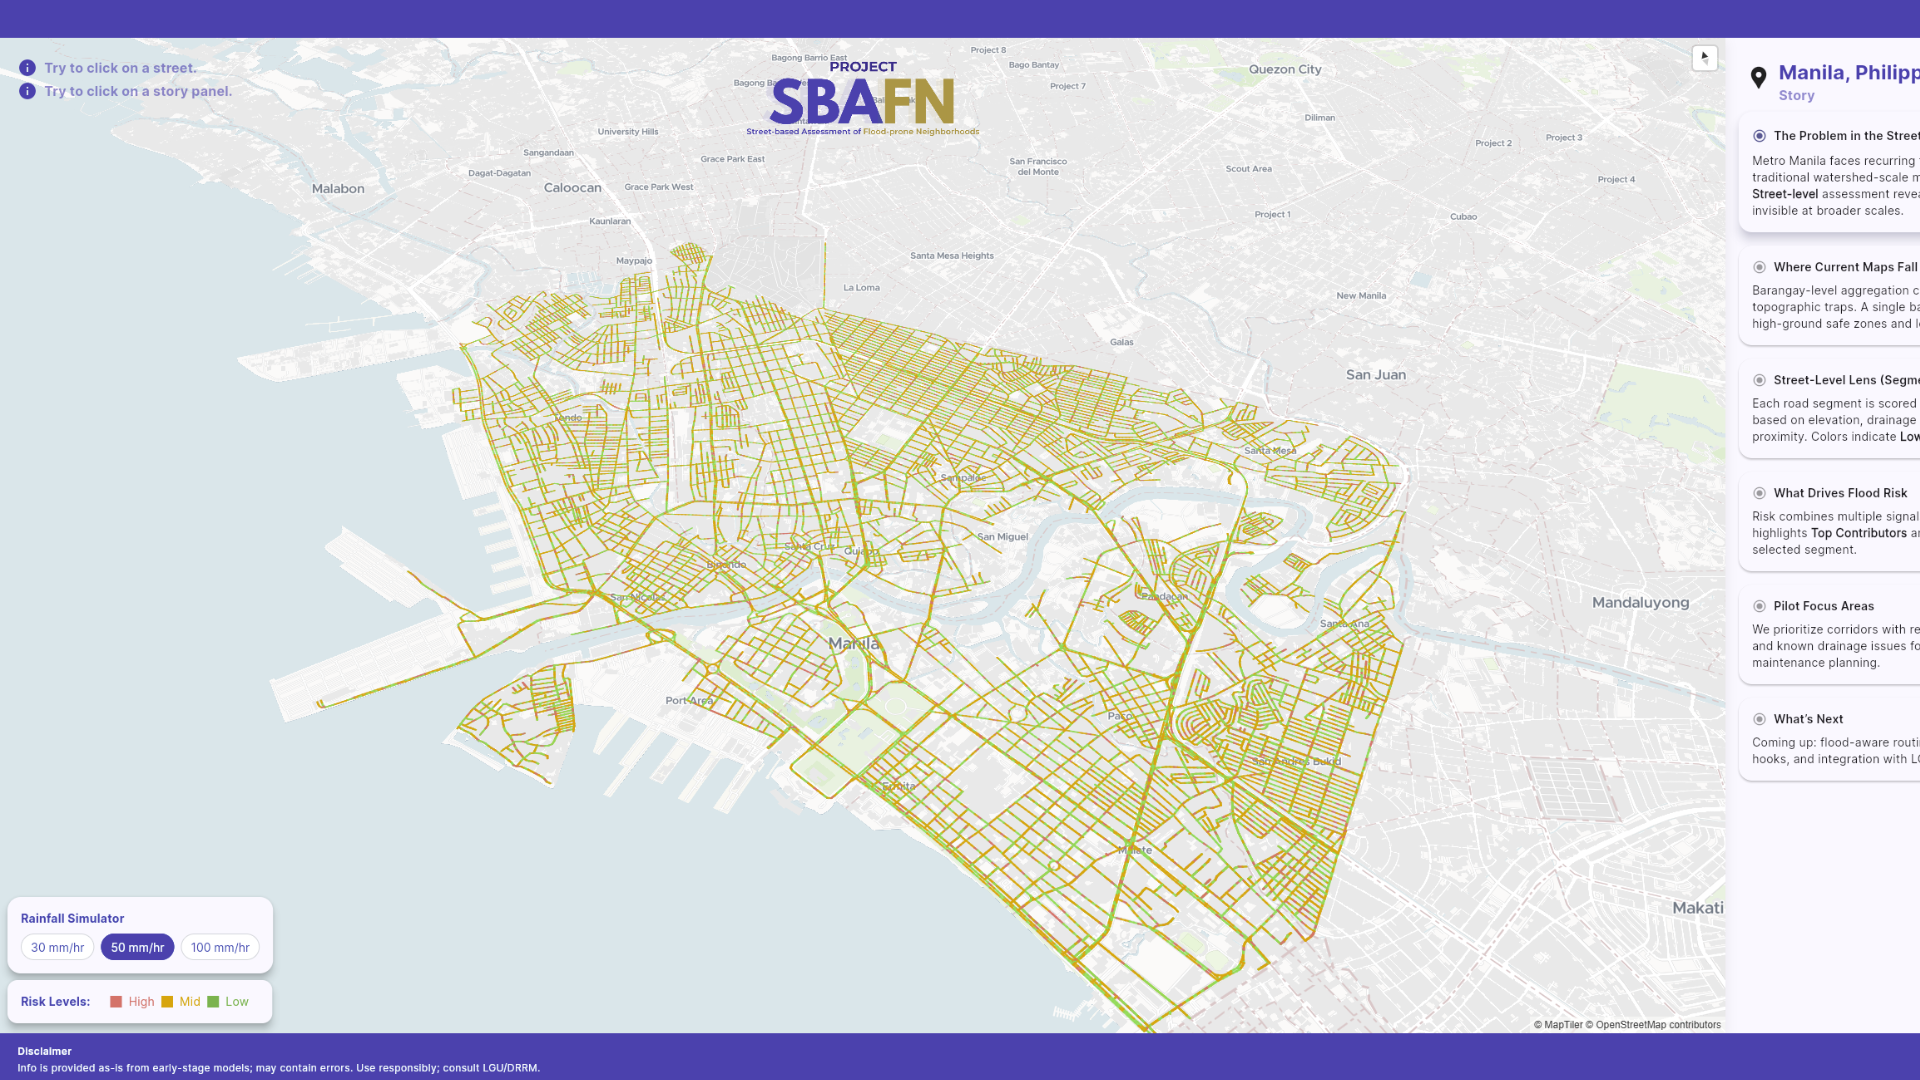
An interactive map of street-level flood-proneness scores in Manila.
Problem
Estimate flood-proneness for individual streets using elevation data and physical indicators.
My contribution
- Collected the digital elevation model (DEM) dataset and integrated it into the backend.
- Built parts of the Flutter interface and map interactions.
- Connected the model’s scores to the map.
Method
01
Geospatial data
Combine elevation and street-level physical indicators from raster and vector data.
02
Detection & scoring
The team used YOLOv11 for street-view object detection and LightGBM with positive-unlabeled learning for scoring.
03
Map interface
Display scores, contributing indicators, and rainfall scenarios of 30, 50, and 100 mm/hr.
Result
A Flutter map with street-level scores, contributing indicators, and rainfall scenarios.
LIMITATIONS
Experimental flood-proneness scores, not live forecasts. Refer to official local hazard information.
NEXT PROJECT